Claude Code orchestrates multiple LLM calls, tool executions, and caching decisions per conversation turn. You see the final output, not the machinery. How many LLM calls did that response actually take? What got cached and what didn’t? How much did that session cost? Which tool calls were expensive? When a response feels slow, you’re left guessing — was it the model, a slow tool, or multiple round trips? Is it looping mindlessly?
Claude Code ships with built-in OpenTelemetry instrumentation.
It’s off by default. Turn it on, point it at a collector, and you get full distributed traces of every session — LLM calls, tool executions, token usage, cache behavior. The instrumentation already exists. You just need to enable it and plug in your observability stack.
Setting Up the Collector to receive data
Skip the config files and the docker-compose plumbing. Use the grafana/otel-lgtm all-in-one image. It’s Grafana, Tempo, Loki, Mimir, and an OTel collector pre-wired together. No configuration needed. One command:
docker run -d --name lgtm \ -p 3000:3000 \ -p 4317:4317 \ -p 4318:4318 \ -p 3200:3200 \ -v /<your persistent path to>/grafana-data:/data \ grafana/otel-lgtm
The ports:
- 3000: Grafana UI — where you’ll view your traces
- 4317: OTLP gRPC — standard OTel endpoint, not used here
- 4318: OTLP HTTP/protobuf — what Claude Code uses
- 3200: Tempo API — used later for querying traces programmatically
The -v mount persists your data across container restarts. Without it, you lose your traces every time you restart the container.
Why this image? Everything works out of the box and for local development and experimentation, that’s exactly what you want.
For Quarkus Developers: You Already Have One
If you’re a Quarkus developer running quarkus dev, you might already have this collector running. The quarkus-observability-devservices-lgtm extension spins up the exact same grafana/otel-lgtm container as a devservice:
<dependency> <groupId>io.quarkus</groupId> <artifactId>quarkus-observability-devservices-lgtm</artifactId> <scope>provided</scope></dependency>
The devservice auto-configures OpenTelemetry for your Quarkus application. To add Claude Code traces to the mix, set OTEL_EXPORTER_OTLP_ENDPOINT (see bellow) to point at the devservice’s mapped OTLP HTTP port. Check your dev mode logs or the Dev UI for the ephemeral port — it’s usually http://localhost:<some-high-port>.
The payoff: Claude Code traces and application traces in the same Grafana instance. When you’re debugging or creating an app in dev mode with Quarkus app with Claude, you see both what Claude did and what your app did in the same place minimizing context switching.
Enabling Telemetry in Claude Code
Configuration happens in two layers: what to emit and where to send it.
Layer 1: System environment variables control what gets emitted. Set these in your shell before starting Claude Code:
export CLAUDE_CODE_ENABLE_TELEMETRY=1export CLAUDE_CODE_ENHANCED_TELEMETRY_BETA=1export OTEL_LOG_USER_PROMPTS=1 # include prompt textexport OTEL_LOG_TOOL_DETAILS=1 # include tool parametersexport OTEL_LOG_TOOL_CONTENT=1 # include full tool input/output
The first two are gates: CLAUDE_CODE_ENABLE_TELEMETRY turns on basic telemetry, CLAUDE_CODE_ENHANCED_TELEMETRY_BETA enables the detailed instrumentation you actually want. The last three control granularity. Without them, you get spans and timings but not the content. With them, you get prompt text, tool parameters, and full tool input/output in your traces.
Privacy note: Those last three flags mean your prompts and tool outputs end up in your Tempo instance. Fine for local development. Think carefully before pointing this at a shared collector.
Layer 2: ~/.claude/settings.json controls where telemetry goes. Add an env block with standard OTel SDK environment variables:
{ "env": { "OTEL_TRACES_EXPORTER": "otlp", "OTEL_METRICS_EXPORTER": "otlp", "OTEL_LOGS_EXPORTER": "otlp", "OTEL_EXPORTER_OTLP_PROTOCOL": "http/protobuf", "OTEL_EXPORTER_OTLP_ENDPOINT": "http://localhost:4318" }}
These are standard OpenTelemetry SDK variables. The env key in settings.json injects them into the Claude Code process. You could set them in your shell instead, but settings.json keeps them scoped to Claude and out of your global environment.
Reading Your First Trace
Say hello to Claude code in the terminal.
Open Grafana at http://localhost:3000. Navigate to Explore, select the Tempo data source, and search for recent traces. You should see a trace from your Claude Code session.
Click into it. The span hierarchy shows what actually happened under the hood:
- Session span at the top — the entire conversation session
- Turn spans as children — each conversation turn, one per user message
- LLM calls and tool executions as leaf spans — the actual work
LLM spans carry the details you care about: model name, token counts broken down by input, output, cache read, and cache create. Latency for each call. Tool spans show tool name, execution time, and if you enabled the detail flags, full input and output.
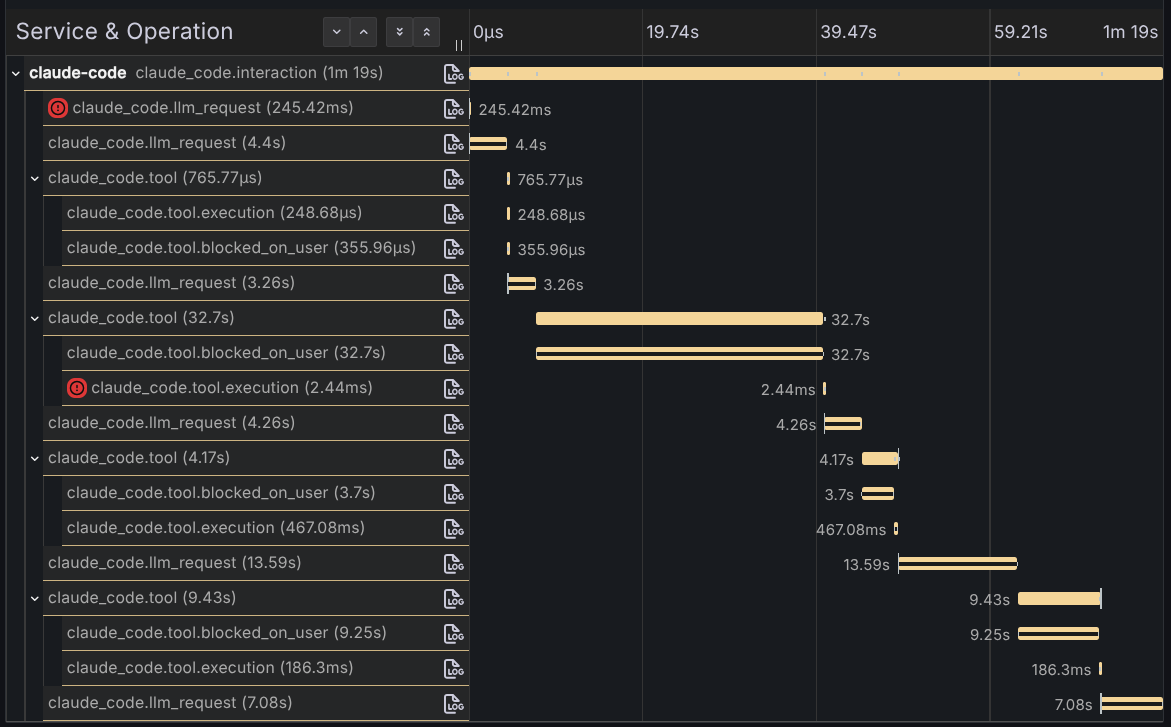
The key insight: what looked like one “response” from Claude was actually multiple LLM calls with tool executions interleaved. You asked a question, Claude read files, called tools, made decisions, generated responses, all orchestrated across several round trips to the model. The trace makes the orchestration visible. You see the caching behavior, the token usage per call, which tools ran, how long they took. You see the machinery.
That’s the shift. Before, you had a black box. Now you have a timeline that you can measure.
Closing the Loop: Claude Queries Its Own Traces
Tempo exposes an API on port 3200. With a Tempo MCP server configured, Claude can query this API directly. Not just view traces in a dashboard, but analyze them, calculate costs, extract insights.
I added the Tempo MCP server to Claude just by telling it to use the MCP server in port 3200. It will figure out what to do.
Then I asked:
Can you list the token cost per span in this trace: 197337e269ade02f7cb7d7fef8c9fc6c
Claude queried the Tempo MCP server, pulled the span data, extracted token counts from span attributes, calculated costs using Opus 4.6 pricing ($15/$75/$1.50/$18.75 per 1M input/output/cache-read/cache-create tokens), and produced this:
| Span | Input | Output | Cache Read | Cache Create | Cost |
|---|---|---|---|---|---|
| LLM #1 | 3 | 193 | 19,621 | 63 | $0.0451 |
| LLM #2 | 3 | 112 | 19,684 | 711 | $0.0513 |
| LLM #3 | 1 | 170 | 20,395 | 136 | $0.0459 |
| LLM #4 | 1 | 617 | 20,531 | 323 | $0.0831 |
| LLM #5 | 1 | 241 | 20,854 | 2,032 | $0.0875 |
| Total | 9 | 1,333 | 101,085 | 3,265 | $0.3130 |
Look at the numbers. Cache reads dominate the token volume at 101K tokens, but they’re cheap at $1.50 per million. Output tokens are the real cost driver at $75 per million. Five LLM calls for what felt like a single interaction. Total cost: $0.31.
The insight isn’t new if you’re paying attention to cost. LangChain4J already provides this data for some models, but in here Claude analyzed its own execution telemetry and surfaced cost per step.
That’s the payoff. Observability isn’t just for dashboards. It’s data. And if the data is accessible via API or an MCP server like in here, Claude can reason about it. Query traces, analyze patterns, calculate costs, debug performance issues, all without leaving the conversation. The system that generates the traces can now analyze them.
For the full reference on all available metrics, events, trace attributes, and configuration options, check the official monitoring documentation.
Note: I wrote the post assisted by Claude Code.